Find your way around Grace
Find your project, talents, and organization settings.
| You want to… | Open… |
|---|---|
| Resume work on a project | Home, then your project. |
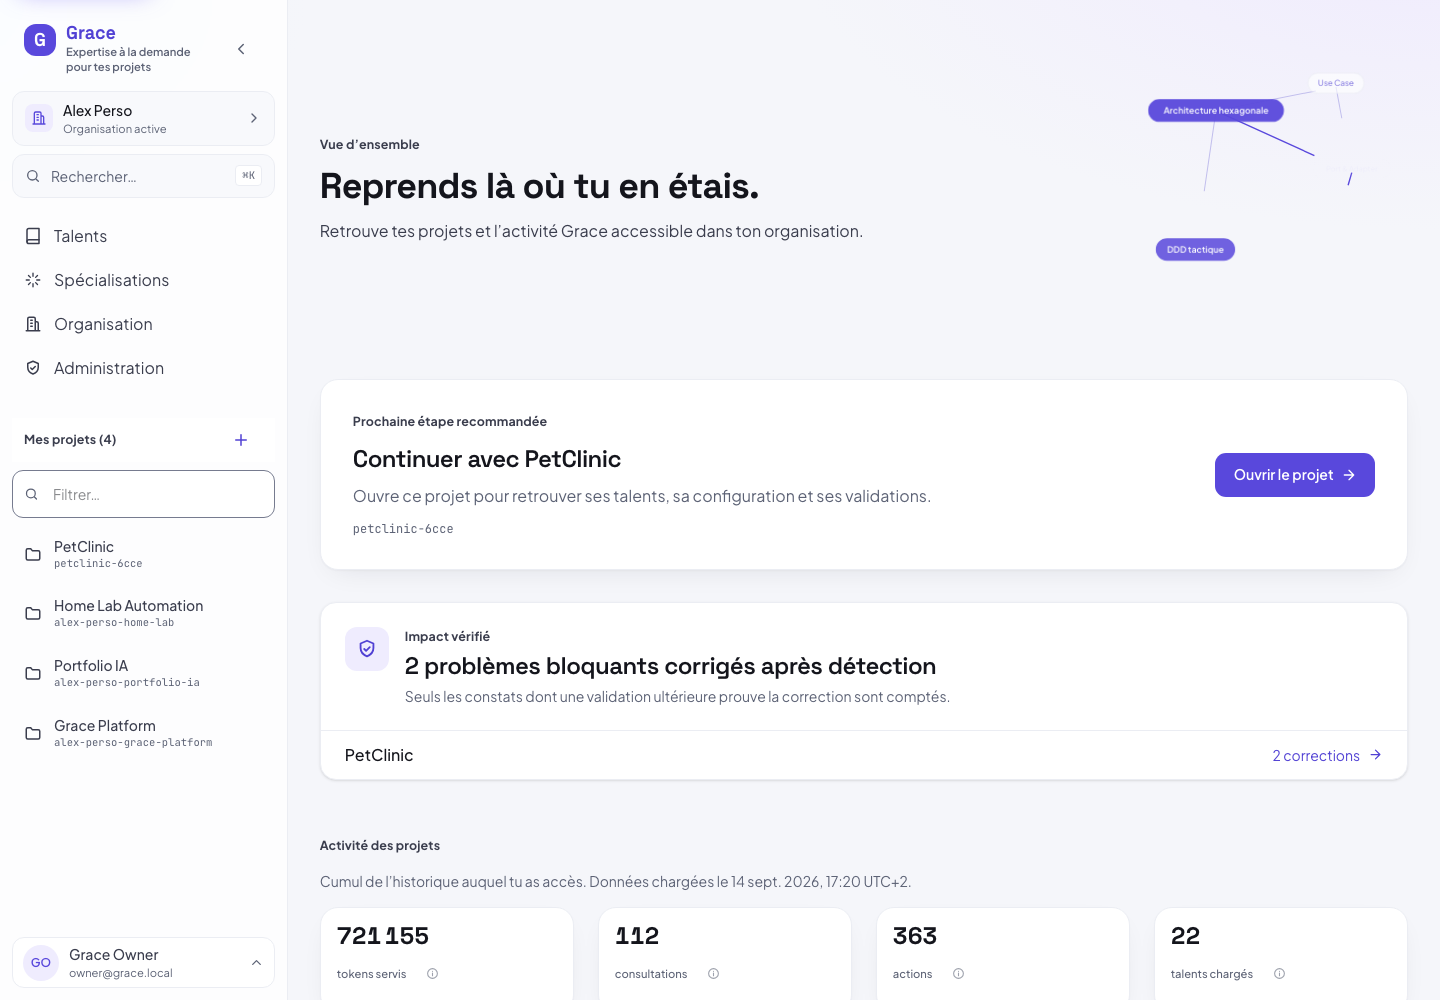
| See Grace's verified impact | Home shows the total number of blocking issues corrected after detection in the active organization. Select a contributing project to see the evidence. |
| Browse expertise | The talent catalog, then a talent page. |
| Check installed talents | Your project, then the Talents tab. |
| Connect your AI agent | Your project's connection guide. |
| Manage members or shared instructions | The Organization area, if your role permits it. |
| Switch organizations | The command palette: ⌘K on Mac or Ctrl+K. |
| Change the appearance | Dark theme or Light theme, at the bottom of the menu. |
Menu and appearance
The main menu links directly to Overview, Projects, Talents, Specializations, and Organization. The active destination stays highlighted. On desktop, you can collapse the menu to an icon rail without losing these destinations; on a narrow screen, Open menu presents the same navigation in a drawer.
Use Dark theme or Light theme at the bottom of the menu. On mobile, the same control remains available in the header. Grace remembers your choice in this browser. If you have not chosen one, it follows your system appearance. Switching themes does not change the information or actions available.
With a keyboard, Skip to content bypasses the menu. Escape closes the mobile drawer and returns focus to the button that opened it.
Your organization
Sections group actions by purpose:
- Team: members, roles, and invitations. Invite a member opens the form; the member menu groups actions related to their access.
- Connections: team sign-in through SSO and connections to code repositories.
- Talents: shared instructions specific to the organization.
- Activity: indicators and comparison of project activity.
- Adoption: installed and used talents, with project-level detail.
Available sections and actions depend on your role. To compare project activity, see Monitor your organization.
What Grace helped correct
On the home page, Verified impact totals blocking issues corrected after detection in the active organization. Only projects contributing to that total are listed, from most to fewest corrections. The calculation covers reviewable rules of Grace Talents as well as the organization's Custom Talents. Select a project to open its details.
When you open a configured project, four indicators remain visible above the tabs: issues corrected, contributing talents, installed talents, and resolutions. Issues corrected, contributing talents, and resolutions cover the last 30 days in UTC, including the current day. Installed talents reflect the project's current configuration.
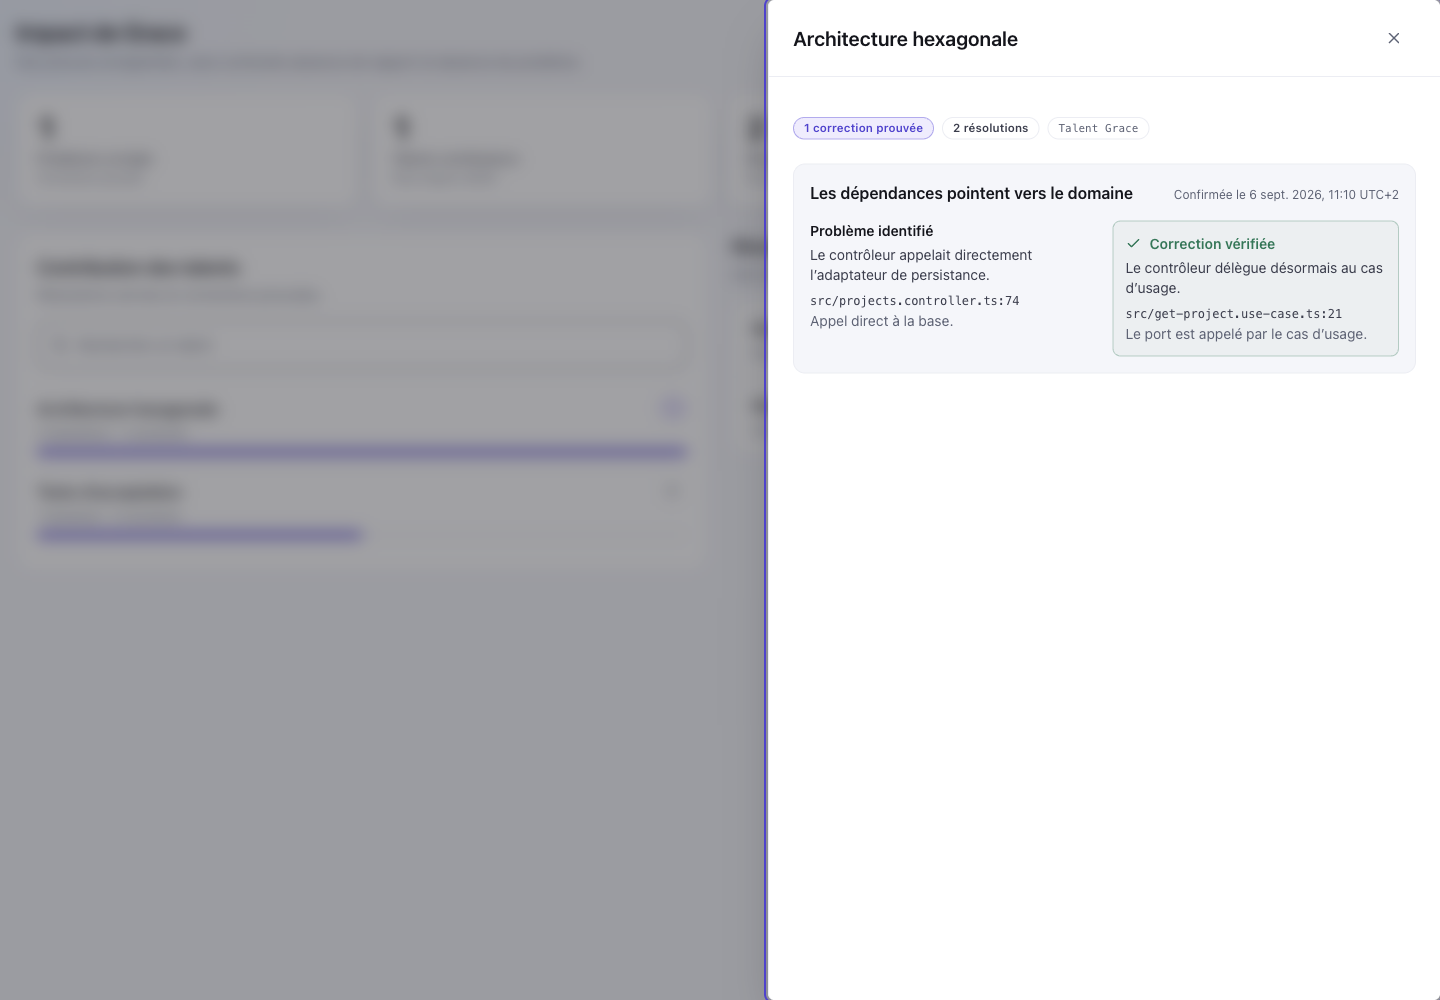
Search for a contributing talent and open it to see each relevant rule, the initial finding, observed files and lines, and the confirmed correction. Grace only counts a "violated" finding followed by a "respected" finding for the same rule and task. Detection alone or a verification that remains uncertain never increases the count.
The Resolutions tab distinguishes corrected, ongoing, and incomplete reviews. Each row shows the short title supplied by the agent and opens in full by keyboard or pointer. The drawer shows the date, author, talents, in-depth readings, reviews, validations, and corrections in a timeline.
Open this resolution provides a stable address to the same details. The dedicated page adds the language, audited talents, and each applied area of expertise with its source, version, reason for selection, triggers, and token count. The compiled context is collapsed by default. Grace's chat link uses this address, even if the resolution is no longer among the 25 most recent. It remains accessible only to project members in the active organization. When there is no usable validation report, Grace shows Unknown impact rather than a misleading zero.
A Grace Talent without a review rule cannot produce proven impact: Grace flags it during review instead of counting it as compliant or corrected.
Times and time zones
Times shown on the dashboard use your browser's time zone, with an explicit UTC offset (for example UTC+2). Daylight saving changes are automatic. Comparison periods and chart days are still calculated in UTC; on the administration overview, the included dates appear above the indicators, with a ⓘ hint explaining the method. Security event details preserve seconds.
Choose an analysis period
Analytics views offer three periods: 7, 30, and 90 days. The selector sits to the right of the section title on desktop and below it on mobile. It updates that section's data. On the overview, it applies to activity; alerts are evaluated separately. The security log also offers custom dates; its shortcuts include the current day.
Your role determines available actions
Members use the projects their organization grants them access to. Owners and administrators manage the organization and its shared rules. Platform administration is a separate area.
An organization awaiting approval displays a step to take: this is not an error in your AI agent. See Accounts and permissions.
To get started, follow Getting started. For a connection problem, see Troubleshooting.
Configure team sign-in (SSO)
Under Organization → Connections, owners and administrators can see whether a provider is configured, its address, and the email domains involved. Configure or Edit opens the form; Hide form preserves your entries while you remain on the page.
Test provider checks that the provider is reachable without signing in a member or saving your changes. A successful test does not guarantee the full sign-in flow will work. Save or Update applies the configuration and closes the form after success. If it fails, your entries remain available for correction.
Team invitations
The Pending invitations section appears under Team only while an invitation is pending. The list is visible directly. After successful creation or cancellation, it updates; the Invite a member button remains available to managers even if the list is empty.
Grace does not yet email invitations. After creation, the Share invitation dialog shows a confidential link to send to the recipient through a trusted channel. The dialog can also be reopened with Copy link from a pending invitation. The link lasts 72 hours and stops working after acceptance or rejection.
A user signed in with an email address verified by Google or the SSO provider sees pending invitations in the organization selector. Each invitation shows the organization, proposed role, sender, and expiration, then opens the acceptance or rejection screen.
Notification center and profile
On desktop, open Notifications from the account menu; the account badge shows the number of unread items. On mobile, the Notifications bell remains available in the header. Both open the same panel, which separates Needs attention from Recent information:
- an invitation can be accepted or declined directly;
- organization owners and administrators see items requiring attention from their operational monitoring;
- platform administrators see the results of Grace deployments.
Opening the panel does not automatically mark its contents as read. Use Mark as read on an item or Mark all as read. Actions then open the relevant Grace screen or, for a deployment, the associated workflow in a new window.
In the account menu, Profile opens preferences. The center remains active in Grace regardless of these preferences. Enabling browser notifications requires explicit permission and can be set separately for invitations, deployments, and items requiring attention.
If permission was denied, Grace tells you to change it in browser settings. Each browser must be enabled separately.
On your first visit, Grace chooses the first supported French or English language in your browser preferences, falling back to English. You can choose Français or English in your profile or on the sign-in page. Your choice stays in this browser. When you manually choose a language while signed in, it also sets the language of messages addressed to you. Browser notifications follow the language of each subscribed browser without changing other devices. Past notifications keep their original language.
Platform administration
Administration is reserved for platform administrators. Open Administration from the workspace. The organization selector and workspace destinations give way to the Platform administration context; Return to workspace lets you explicitly leave it. Its nine destinations are grouped by question: Monitoring (Operational health, Usage, Adoption) to spot discrepancies, Agent activity (Task history, Code reviews, Agent feedback) to understand agents’ work, and Access and security (Organizations, Users, Audit log) to manage access and find sensitive actions. Only one destination is highlighted at a time.
The Operational health view displays any critical signal at the top, followed by compact indicators, the Preparations per day chart, and the queue of items to monitor. An observed preparation is not a completed task. The critical warning’s link takes you directly to triage. Each row aligns the priority, signal, observed value, its reference, date, and Review action. Choose 7, 30, or 90 days; each value is compared with a previous period of the same duration. The current day is excluded. The information button beside an indicator explains its definition; “View details” opens its data. Alerts are independent of the selected period.
Review service quality
In Operational health, the MCP preparation quality section lets you compare HTTP successes, 4xx rejections, 5xx failures, and server-side p95 latency for recorded MCP preparations. These measurements are SLIs. No SLO is configured here. An SLO is a service-level objective for a specific population and window; p95 is the duration under which at least 95% of observations fall.
- Choose 7, 30, or 90 complete UTC days using the Health period selector.
- Check the window, latest observation, and denominator before interpreting a rate.
- Compare the four measurements in their shared card, then the five projects in the table card. Projects with the most responses outside HTTP 200–399 appear first.
- Choose View all projects to search all observed projects by name, sort a column, and browse results 25 at a time.
- Choose Review to inspect the project’s preparation calls: date in local time, HTTP response, server duration, and route. The window remains the same as for the indicators; Back to results preserves your search, sort, and page.
Percentages are rounded to at most two decimal places; success and preparation counts remain exact. The information button beside the title opens the methodology without hiding the results. Search covers project names, not call contents.
This view displays only observed measurements, with no simulation or objective configuration.
This report does not provide a dedicated measurement for the application, MCP pentest, platform, talents, or documentation. The ⓘ button explains the difference between a measurement and an objective. The Measurement scope callout connects the partial coverage and absence of an SLO to the results. Preparations by project shows observations, not alerts: ranking by responses outside HTTP 200–399 does not indicate incident severity. Its ⓘ button explains the sort order. Usage reuses this callout for coverage, tokens, and unavailable costs. Adoption keeps the rate reference and the non-sequential nature of the groups visible in How to compare these groups. Icons supplement labels; they do not indicate validation. Items to review use a fixed 30-day period, shown beside their help. In analytics views, Refresh data remains beside the report’s received date; that date guarantees neither freshness nor completeness of collection.
Collection is not exhaustive: this rate is not Grace’s overall availability. Preliminary access checks, collection losses, and network paths are not measured here; deleted projects are no longer part of the population. The calculation date does not certify the source’s freshness. No contractual budget or rapid-consumption alert is provided.
No observations does not mean 100% success. An Unavailable source offers a retry; Refresh observations reloads the data. Permissions remain those of platform administration, even for an organization administrator.
Read the other analyses
Usage answers “how many calls and tokens are served?”; Adoption answers “who uses Grace, with what practices and feedback over time?” These two views remain distinct: high volume does not prove sustained adoption.
Period controls appear below the title, before the results. Health, Usage, Adoption, and Task history offer the same 7 days, 30 days, and 90 days choices, which take effect immediately. Reviews retains a calendar and a comparison that must be confirmed with Apply; the Audit log retains arbitrary dates and shortcuts that include today. Feedback, Organizations, and Users have no time filter.
Before the results in the Operational health, Usage, Code reviews, Task history, and Adoption views, a banner recaps the information needed to interpret the data: scope, period, and comparison, then freshness, population, or quality when the source provides it. Missing data is not replaced with an invented value.
Administration lists use the same tables. In Usage, choose a view: Organizations, Users, or MCP tools. Each view retains its scope; user filters do not apply to the two platform views. Choose the period, then sort organizations by name, calls, tokens, active users, or latest activity. The User activity report applies the same definitions at the platform, organization, project, or individual level: an active user made at least one served call during the period; a new user makes their first call in the scope during that period; a returning user had activity previously. Filters, view, and page remain in the URL. Raw volumes are not normalized by organization size; tokens represent served context, not cost or time saved. Usage, Adoption, and Task history use completed UTC days, up to and including yesterday, like Operational health. Code reviews also use UTC by default; choosing Europe/Paris or a custom period changes the boundaries and must be taken into account before making any comparison. Navigation preserves compatible durations of 7, 30, or 90 days, but does not carry over a custom calendar period or another time zone.
Refresh data reruns the report with the current filters. “Report received at” shows when the latest successful response was received, in UTC, not the time of the latest event or a guarantee of completeness. A refresh failure is reported explicitly. Traces may be missing or arrive late, even for a completed day.
Interpret costs and level of evidence
In Usage → Organizations, check coverage beside tokens before comparing volumes: Observed means all recorded traces have a measurement; Partial indicates how many have one. Not measured does not mean zero consumed. The latest measurement applies to the selected period; older measurements are flagged. Incomplete collection may miss calls even if all recorded traces are measured.
Billed costs and Time saved and return on investment remain unavailable: Grace collects neither model-billed consumption nor pricing, nor an independent measurement of gains. To make a budget decision, reconcile volumes with provider statements for a compatible period, model, price, and currency. Usage provenance and limitations explains why served tokens cannot be divided by MCP calls: they also cover web actions.
In Code reviews, Level of evidence distinguishes three levels:
| Level | What you can conclude |
|---|---|
| Observed by Grace | Preparations were recorded, not necessarily completed tasks. |
| Reported by agents | Reports were received; their verdicts and references remain self-reported. |
| Independently verified | Unavailable: no independent verification is collected. This is not a count of failed or passed tests. |
The date of the latest report received appears under Reported by agents. The ⓘ button Report provenance, freshness, and coverage opens the definitions and the number of verdicts with references. Coverage applies to reports received during the period, including revisions; it does not use the cohort of the first report within 24 hours used for outcome rates. A reference to a test or a URL does not prove that the test was run. The correction details retain the resolution, frozen obligation, and reported references; the absence of a reference is explicit. Before concluding that something is effective, compare these elements with an independent review or run on the same version of the code. The report calculation time is not the time of the latest report.
Continue the investigation
In Task history, each preparation is linked to its follow-up details and review. The list keeps the information needed to choose a task; View details opens its metrics, timeline, and technical identifiers. The URL retains the open task even if it is not on the selected page: details are searched across the entire chosen period and scope. A resolution outside that scope is flagged; close the details to adjust the filters. A loading error offers Try again without losing the list. Cumulative API time is the sum of call durations, not the duration of the work. “Review served” does not mean code was verified or work completed. Incomplete or failed calls remain identifiable. The ⓘ button beside Call status explains the statuses; code not verified remains visible. The Calls without a task action at the top of the page opens a separate table of recorded calls without an identifiable task: this is not in itself an outage. Compare the call, project, response, and date, then open the project or organization to continue the investigation. Pagination is independent of task pagination and remains in the URL. Closing the panel returns to the list without losing its filters or page. In the Audit log, All dates in the period menu removes only the date boundaries and returns to the first page; search and other filters are preserved. Filters and totals apply to all results, not just the displayed page. In Organizations, search by name or slug and filter by status. In Users, search by name or email and compare identity, status, platform role, organizations, and creation date. Opening a record and then returning restores the list context.
In an organization record, usage comes before projects, members, and history. Search members by name or email and filter them by role; sort them by name, role, or join date. Search projects by name or slug, filter their category, and sort them by name, category, or creation date. A row opens the corresponding user or project record, and returning preserves the organization view. Records also offer direct links to adoption, workflows, usage, or the security log to continue the investigation.
In a user record, platform access and memberships come before active web sessions and MCP activity. You can revoke a specific session, or all of their sessions, after confirmation. Grace shows the device, creation time, latest known update, and expiration, but does not present the update as proof of the latest activity.
In Adoption, choose 7, 30, or 90 days, then an organization, project, and available cohort: new users, previously active users, or all attributed users. These filters remain in the URL. The usage comparison appears before the trend; the period, comparison, cohort, and quality are recapped before the values. The detailed calculation method remains available in a collapsed section at the end of the page.
The view compares users who prepare, investigate further, load a review, receive a served review, and prepare again on a later day. These groups are neither exclusive nor sequential: this is not a conversion funnel. A return within the window is not a retention measurement. Each rate shows its volume and the number of users who prepared, which serves as the denominator. The previous period of the same duration provides the previous count and the difference, visible directly in each group. The information button beside the title opens only its definition. The daily trend precedes the previous cohort’s return and has no comparison series; View exact values opens the keyboard-readable table, which does not rely on hover or color. Preparations without an attributable user are excluded from rates and flagged as partial data.
The User return card groups the number who returned, the reference population, the rate, and the ⓘ button. It tracks a fixed population: users who prepared in the previous window, according to the group selected for that date, and then prepared again in the current window and the same scope. Users who do not return remain in the denominator; new entrants in the current window are excluded. An empty population yields an unavailable rate, not 0%. Tracking across two windows proves neither sustained loyalty nor a causal effect of Grace. The groups in the usage comparison, by contrast, are recalculated in each window. The ⓘ button beside the title explains this population and its denominator without hiding the results. The Period and method ⓘ button beside the dates explains the UTC windows and this recalculation. For the New users and Previously active users groups, a short caveat remains attached to the Cohort field to avoid confusing them with a fixed population.
In Code reviews, the Review outcomes page first presents tasks with reported corrections and reported issues across comparable projects and rules, then results by talent. These are agent reports, not an independent audit. The visible Team activity and retention section groups adoption, four-week retention, expansion to other projects, and changes in activity. These indicators do not measure Grace’s effectiveness. Indicator information buttons open their definitions in a panel; values, comparisons, and warnings remain visible, including in the adoption flow. Only one trend is shown at a time: organizations, projects, or prepared tasks. A chart comparison is overlaid only when durations and intervals match; both exact-value tables remain available. Distinct organizations and projects per interval are not summed across intervals. Talents are associated with corrections, without an effectiveness podium; multiple talents may be associated with the same task.
The details for an activity indicator show its value, change, daily chart, and available contributors. The “Understand this indicator” help explains the calculation.
Classify agent feedback
This screen is restricted to platform administrators. Open Agent activity → Agent
feedback to find voluntary feedback prepared with the grace-feedback
prompt by an AI agent connected to Grace, then submitted with the user's
explicit approval. This is not the issues reported in code reviews. Search
the contents and filter by status, classification, or archive, then open a
row to read the content and any screenshot. Classification and external
follow-up come before traceability, which remains in collapsed details
showing the client tool, its version, the MCP protocol version, and, after
processing, the classification date and identifier.
Choose Bug, Idea, Question, or Other, add an internal note if needed, then select Classify. You can then transfer the feedback to Fider or to the GitHub repository linked to the project, copy it without archiving it, or reference an existing request. A transfer archives the feedback after successful creation in the external service. GitHub requires an active repository linked to the project.
Archive removes feedback from the active view without deleting it. The Archived filter lets you find it again. The Deletion date remains unchanged: Grace deletes the report and its screenshot 30 days after submission, including archived items.
Search a selection list
Open a selection list to search for an option, then select it. For single choices, the menu closes after selection. In filters with "All" options, that option restores the full scope. Lists that allow multiple choices remain open for additional selections.
Investigate the security log
This screen is restricted to platform administrators. Search an actor's name or email, or an event, actor, target, organization, or operation identifier. Results update after a short pause in typing; Enter immediately starts the search. The search covers the whole log.
Combine it with an event type, organization, and period. The 7-, 30-, and 90-day shortcuts include today; selected days are in UTC. Event times remain displayed in the browser's time zone. Remove a filter with its cross or choose Reset.
Criteria, sort order, and page remain in the URL: refreshing or returning in the browser restores them. Every row shows the result and reason before you open its details. The drawer shows the result, reason, and summary first, followed by the actor, organization, and target. Project and operation identifiers remain collapsed under Technical identifiers.
Refresh reloads the results. Open Export, then choose CSV or JSON to download all filtered events, not just the visible page. Above 10,000 events, narrow the period or add a filter: no partial file is produced.
Choose a date and browse results
Open the calendar to select a day. Dates outside the permitted range are disabled. Arrow keys move the selection, Enter confirms, and Escape closes the calendar. Clear date removes a previously selected date.
Pagination shows the displayed results and the total. Use page numbers or arrows; for long lists, the jump field lets you go directly to a page.