Grace KPIs
Track Grace adoption and reported improvements for the Grace team.
Open Administration → Monitoring → KPIs to see whether teams use Grace, return to it, and expand it to their projects, then examine the improvements reported by the AI agent.
This page is restricted to platform administrators. Being an organization administrator is not enough.
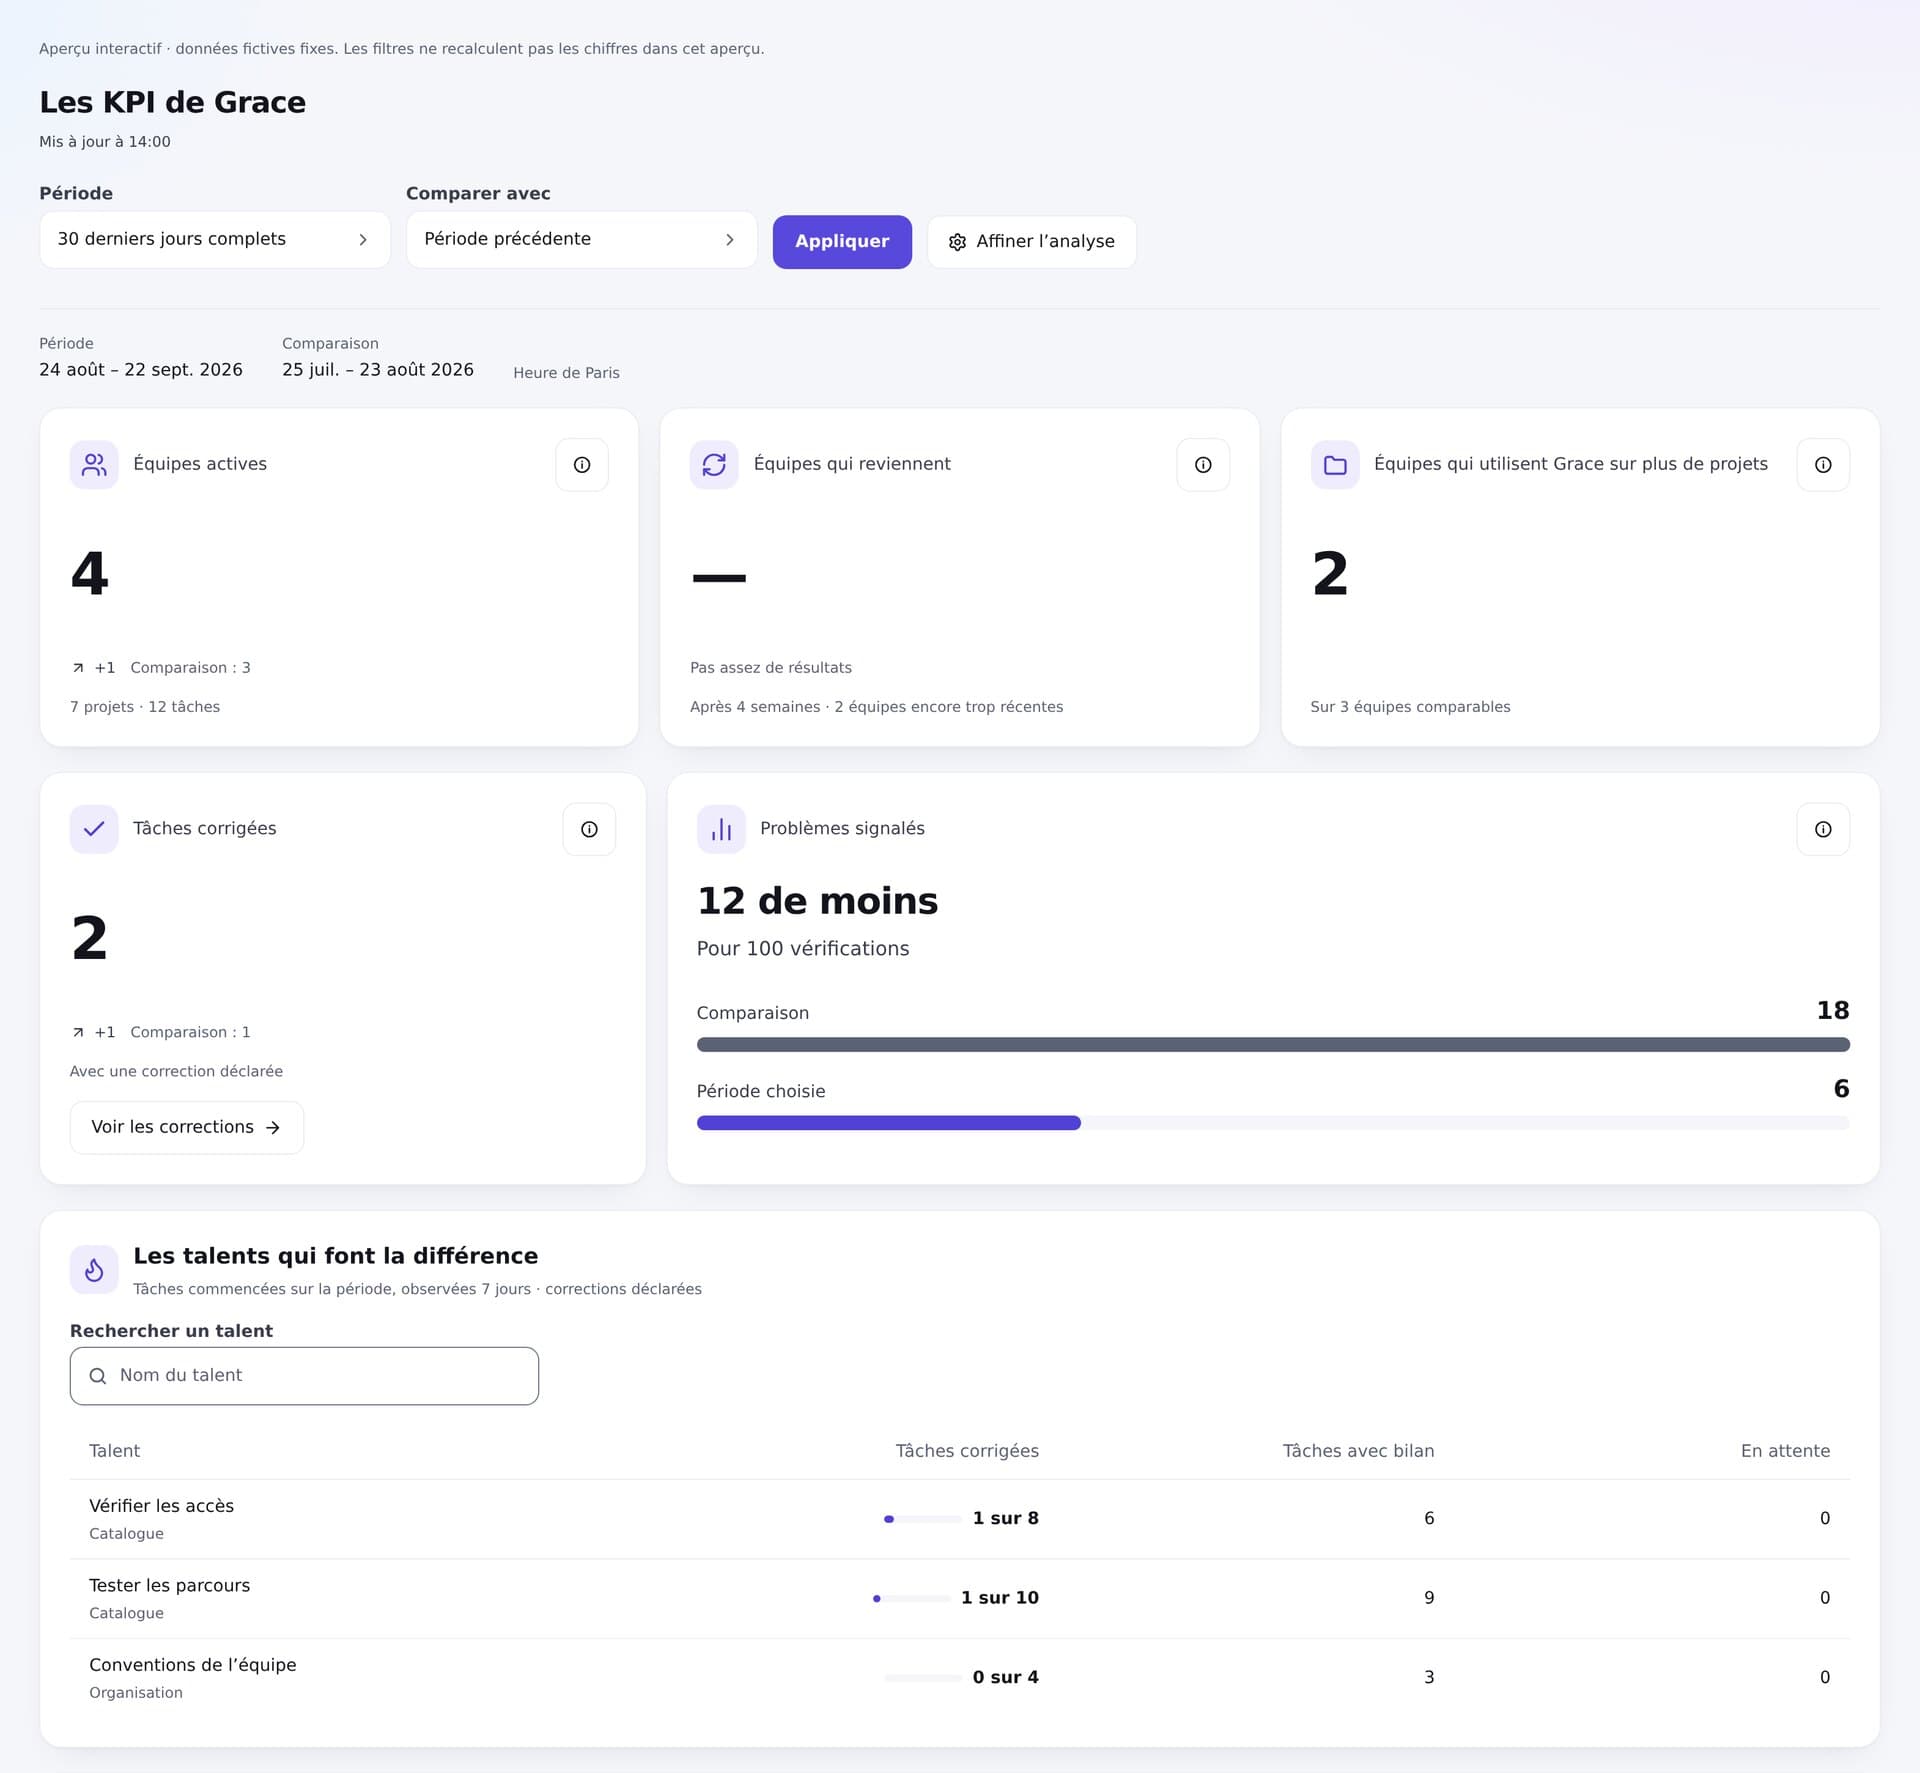
Historical screenshot of the running page in French, with fictional data: these figures illustrate how to read it, not Grace's actual results.
Choose dates
- Under Period, choose 7, 30, or 90 complete days, the previous month, or your own dates.
- Under Compare with, choose Previous period, Previous year, Custom period, or No comparison. Previous period means the days immediately preceding the selected dates. The two compared periods have the same number of days.
- Click Apply. The summary below the filters shows dates for the Period and Comparison, with the time zone shown once. It always matches the figures displayed: changing a filter without applying it does not change this summary. Applied choices remain in the page's URL.
The page starts with the last 30 complete days, compared with the preceding 30 days. The current day is excluded. A custom period can range from 1 to 366 days. Refine analysis lets you choose an organization, project, time zone, or grouping by day, week, or month. The initial time zone is Paris time, with automatic daylight saving changes; UTC is also available.
Apply also fetches the latest results without changing the filters. During Updating…, previous figures remain visible with their dates. Updated at… shows the time of the last successful calculation in the report's time zone. If it fails, a message lets you retry.
Read the six indicators
| Figure | What you learn |
|---|---|
| Active teams | How many organizations prepared at least one task with Grace? |
| Returning teams | Among observable new teams, how many still use Grace four weeks after their first task? |
| Teams using Grace on more projects | How many teams use Grace on more projects than before? 2 means two teams among those active in both periods. |
| Corrected tasks | How many tasks have at least one reported correction during the period? Several corrections to the same task only count once. |
| Reported issues | For the same projects and rules, are there fewer issues per 100 checks? |
| Talents making a difference | For each talent, how many tasks have a reported correction compared with the number of tasks supported? |
The three cards at the top show adoption. The donut chart represents returning teams; the two bars compare reported issues. 12 fewer — per 100 checks indicates a decrease in the rate, not twelve bugs fixed. Both values are visible without clicking or hovering. The Understand the comparison button shows which projects, tasks, checks, and share of tasks with a report were compared. Warnings remain on the card. Small changes on the other cards show the difference from the comparison period: +20 pts means 20 percentage points, not a 20% increase. The information button explains each figure and its limitation without repeating displayed values. A change shows a difference, not proof that Grace alone caused it.
Returning teams are those that started during the selected period, within the filtered scope. We look for a new task 28 to 34 days after their first task, then wait until the end of that week. Over the last 30 days, new teams are still too recent: choose an earlier period to measure whether they returned.
In the talent table, Corrected tasks: 1 of 8 means the agent reported a correction on one of the eight tasks supported by that talent. The bar shows this share, without a percentage to interpret. The eight tasks include those without a report; Tasks with reports shows how many have agent feedback. Without a report, we do not know whether the work improved. Each task is observed for 7 days. Recent tasks are Pending and are not yet included in the comparison. A task may use multiple talents: do not add their rows together. 1 of 1 is not enough to claim one talent is better than another.
Talents with the most corrected tasks appear first, 10 per page. Search talents searches the entire list, not just the current page. Clear search restores the full list. Pagination disappears if results fit on one page. A new search or new results return to the first page.
On narrow screens, figures and their labels appear beneath each talent's name. All measures in every row remain visible without horizontal scrolling.
Check what changed
Click View corrections, then open an example. You'll see what the problem was, what the agent says it changed, the dates, and the evidence it cites. The list shows the period's 20 most recent corrections; the count includes all corrections. Escape closes the panel and returns focus to the button.
Below the figures, one chart shows active teams: a solid line for the selected period, dashed for the comparison. The shared scale begins at zero and adapts to values from both periods. Days are aligned from the beginning of each period. Tables below the chart use the Period and Comparison titles, the same solid and dashed markers, and the dates immediately below. They stay open, with 10 rows per page. One pagination control below both tables advances them together. Page 1 of 3 shows your position; the chart and KPIs still cover the full period. Navigation disappears when everything fits on one page. Weeks and months may have different boundaries: read the dates in each table. If one ends before the other, All dates have been displayed. replaces its rows without introducing false zeroes. Automatic grouping uses days for periods up to 31 days, weeks up to 120 days, then months. Values remain readable without hovering or horizontal scrolling. Dates are abbreviated without losing their boundaries; a period spanning two years retains both years. Open Method and limitations to read what is counted, the observation delays, and what the figures do not prove. Every explanation is visible in the panel without expanding a section.
Do not confuse fewer issues with fewer reports
The quality comparison uses the first report received within 24 hours, on the same projects, talent versions, and rules. It also preserves the weighting of rules from the comparison period: doing more easy tasks is not enough to create the appearance of an improvement. Corrected tasks are counted on their correction date, even if the task started before the period. This count differs from the talent table, which tracks tasks started in the period.
A dash or Not enough results does not mean zero. Without shared rules, quality is Not yet comparable. A missing, empty, or inconclusive report proves no success.
If reports become less frequent, the page advises reading the comparison cautiously. Warnings also flag a decline in the number of tasks or overlapping periods. Grace presents the agent's reports; it does not independently verify the code and promises neither bug-free work nor time saved.
Nothing to measure for these dates: widen the period or remove a filter. If there is an error, check your dates and try again.
For access permissions, see Accounts and permissions.